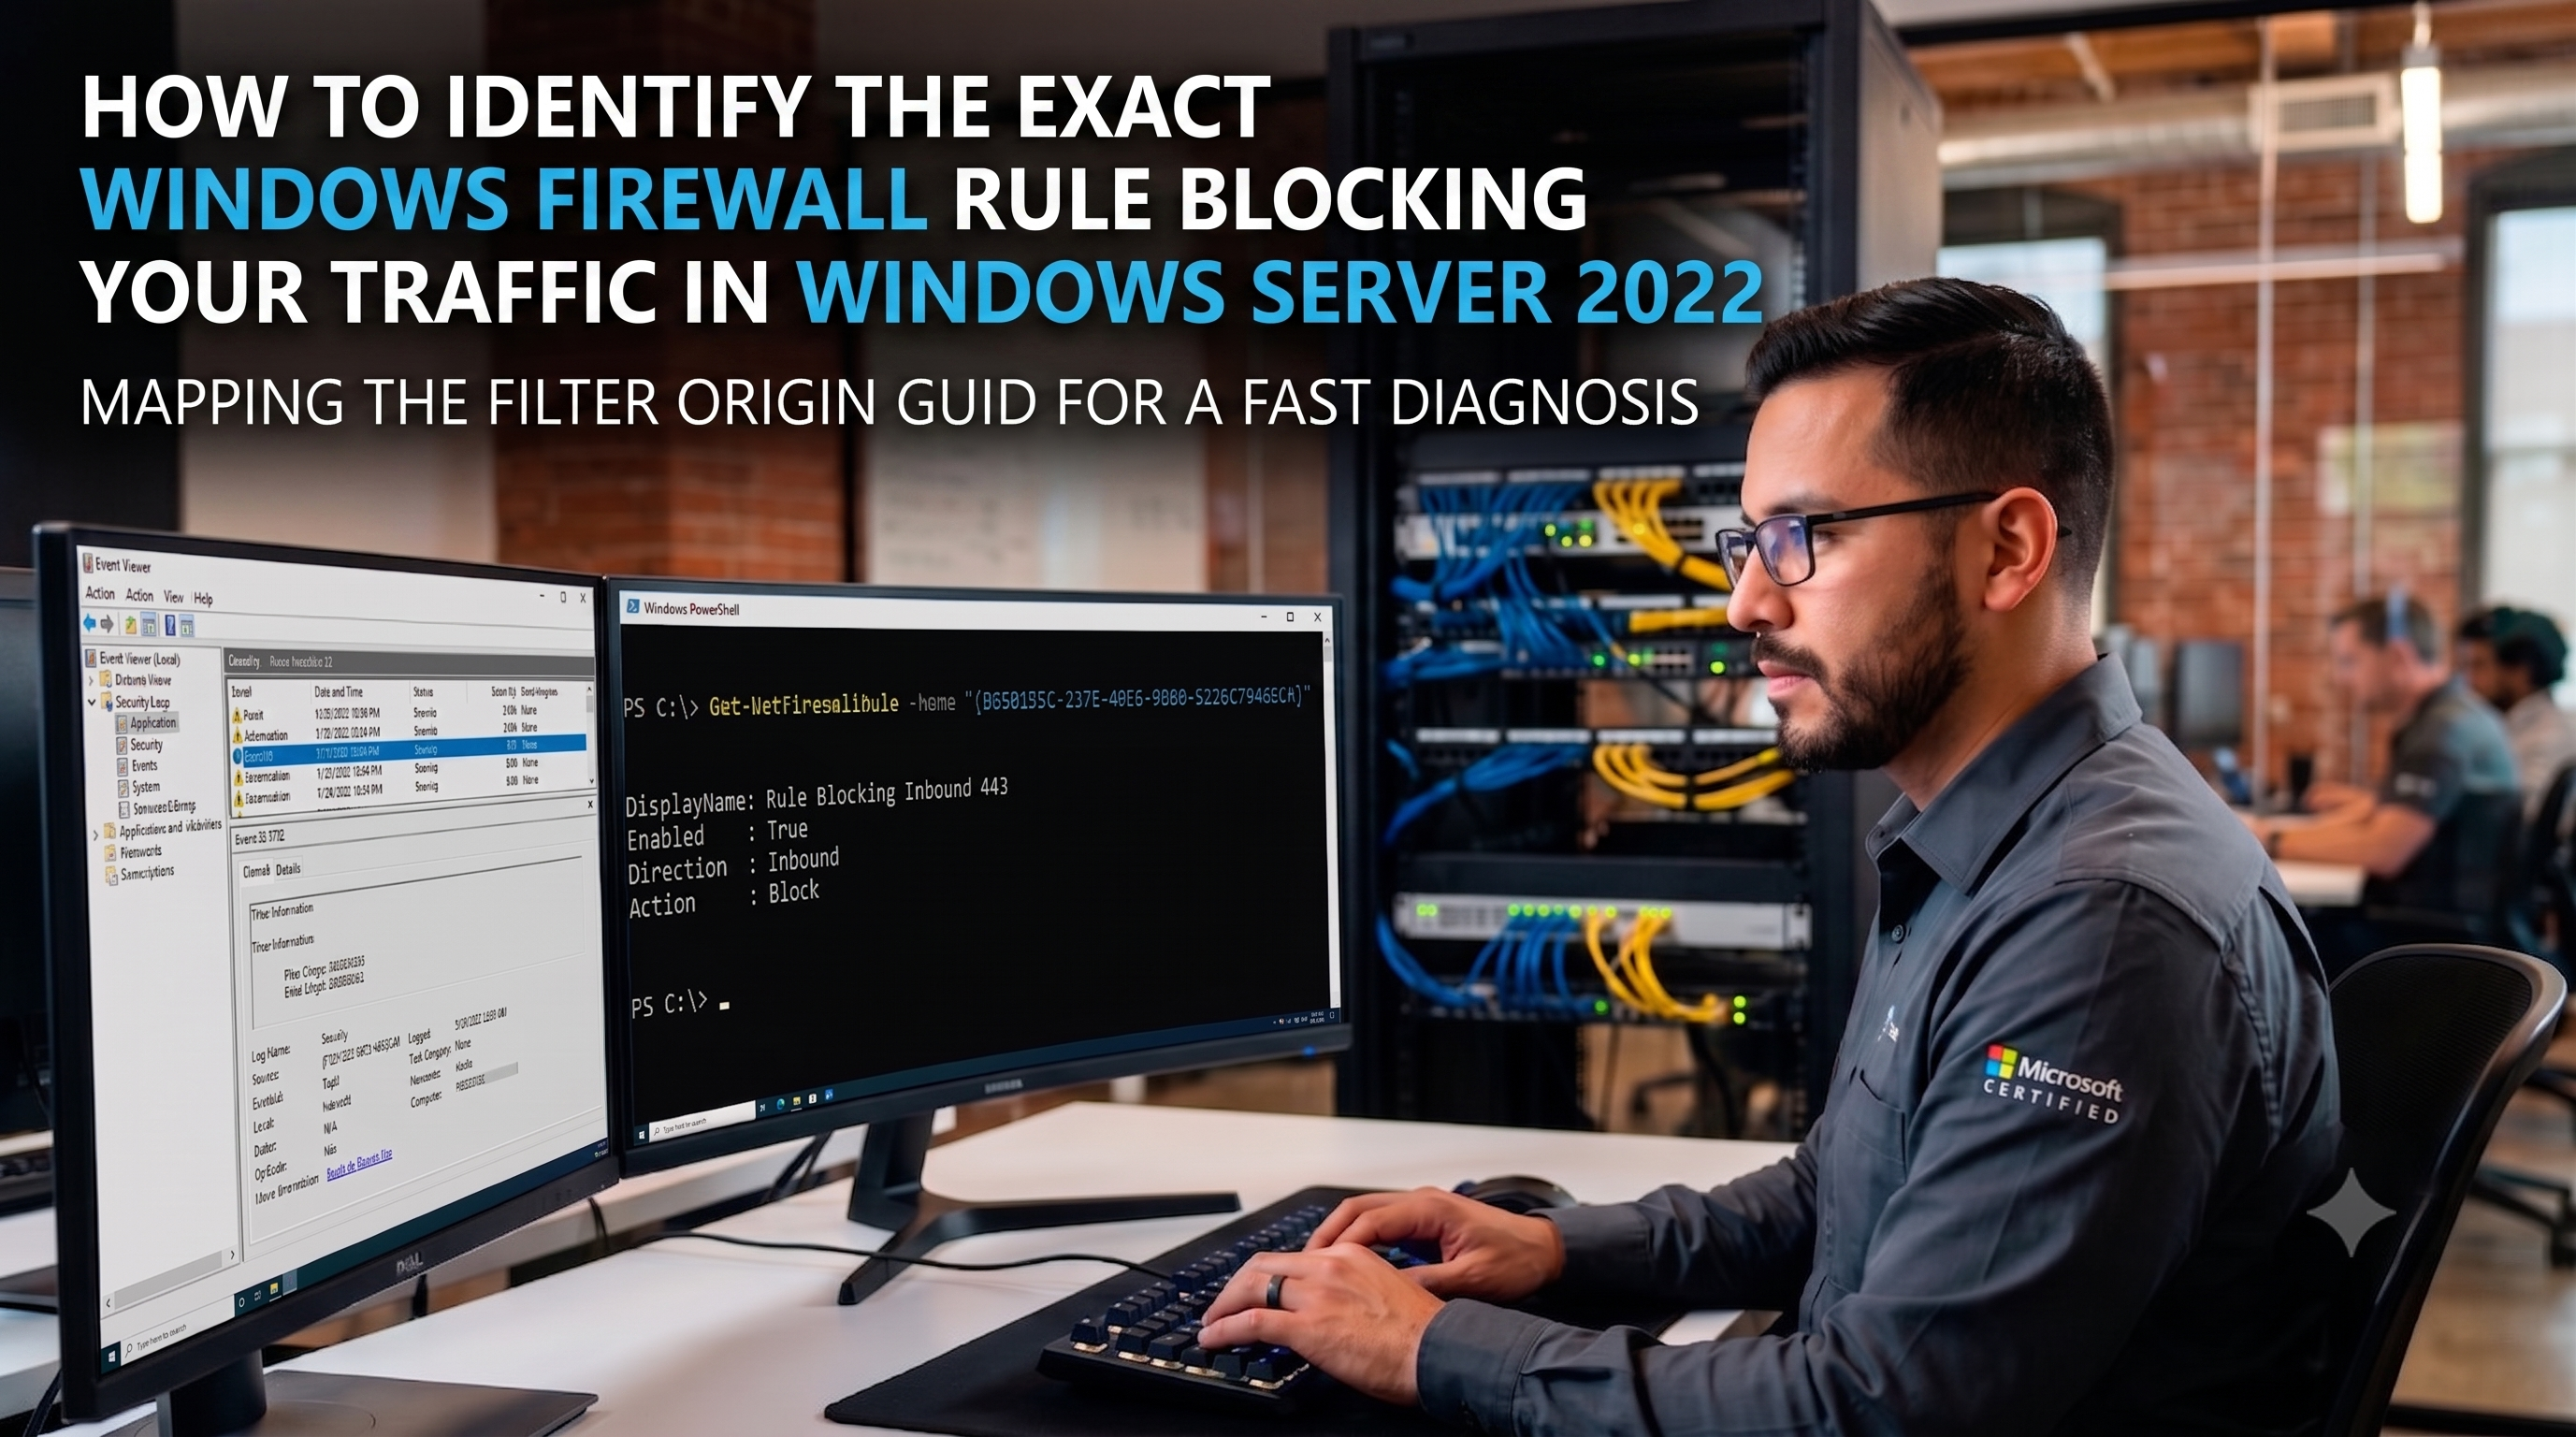
How to Identify the Exact Windows Firewall Rule Blocking Your Traffic in Windows Server 2022
Diagnosing blockages in the Windows Filtering Platform (WFP) used to require complex analysis. With the arrival of Windows Server 2022 and the Filter Origin property, it is now possible to link Event ID 5152 to the relevant firewall rule in four simple steps. See the step-by-step guide.
Richard Sessa Alcaraz
Published 23 July 2026
Anyone who has worked in Windows systems administration or network troubleshooting has faced that frustrating scenario: connectivity between two machines fails, you strongly suspect the firewall, but determining which specific rule is dropping the packets turns into a needle-in-a-haystack search.
Historically, the Windows Filtering Platform (WFP) logged block events using a runtime ID (Filter Run-Time ID). The problem with this ID was its volatility: it changed after every reboot or service restart, forcing admins to rely on tools like netsh wfp show state to dump the WFP XML database and manually map the rule in question.
Fortunately, starting with Windows Server 2022, Microsoft introduced a much-appreciated improvement to audit events: the Filter Origin field. Thanks to this feature, you can trace the exact origin of a drop directly and within seconds.
In this article, we'll walk through the step-by-step process for diagnosing these blocks.
Step 1: Enable Windows Filtering Platform Auditing
By default, Windows does not log every blocked packet or connection in the Event Viewer to avoid cluttering system logs. Therefore, the first step in our troubleshooting process is to enable auditing for the relevant category.
Open a command prompt (CMD or PowerShell) with administrator privileges and run the following commands:
auditpol /set /category:"System" /SubCategory:"Filtering Platform Packet Drop" /success:enable /failure:enable
auditpol /set /category:"System" /SubCategory:"Filtering Platform Connection" /success:enable /failure:enable
Once these two subcategories are enabled, the Windows Event Viewer will start logging the actions performed by the filtering engine.
Step 2: Identify the Block Event in Event Viewer
After enabling auditing and reproducing the connectivity failure (for instance, by attempting a request to the blocked IP or port), head over to Event Viewer, under:
Windows Logs > Security
Within this section, various event types will be generated depending on the subcategory:
Events in the Filtering Platform Connection Subcategory
5031: The Windows Firewall Service blocked an application from accepting incoming connections.
5154: The WFP has allowed an application or service to listen on a port for incoming connections.
5155: The WFP has blocked an application or service from listening on a port.
5156: The WFP has allowed a connection.
5157: The WFP has blocked a connection.
5158: The WFP has allowed a bind to a local port.
Events in the Filtering Platform Packet Drop Subcategory
5152: The WFP blocked a packet (The Windows Filtering Platform blocked a packet).
5153: A more restrictive WFP filter blocked a packet.
The key event to look for when tracing explicit packet drops is Event ID 5152.
Step 3: Analyse Event Details and the Filter Origin Field
When inspecting a 5152 event in the General or Details tab, you will get granular details about the dropped traffic:
Process and Application: The path of the executable involved in the traffic.
Network Information: Source IP address, destination IP address, source port, destination port, and protocol.
However, the truly valuable piece of data in Windows Server 2022 is located under the Filter Information section:
Filter Origin:
{F0381551-2372-49C6-9668-5226C7946EC4}Filter Run-Time ID:
72246Layer Name:
Connect
Unlike the Filter Run-Time ID (which, as mentioned, changes with every session), the Filter Origin value contains the firewall rule's permanent GUID that triggered the block action.
Step 4: Reveal the Rule Name via PowerShell
With the GUID retrieved from the Filter Origin field, the hardest part is done. Now we simply need PowerShell to translate that unique identifier into the human-readable rule name.
Open a PowerShell terminal and run the Get-NetFirewallRule cmdlet, passing the GUID to the -Name parameter:
Get-NetFirewallRule -Name "{F0381551-2372-49C6-9668-5226C7946EC4}"The output will display the rule's full properties, most notably:
DisplayName: The rule name as it appears in the Windows Firewall GUI (e.g., TEST rule block 443).
Enabled: Indicates whether it is active (
True).Direction: Traffic direction (
InboundorOutbound).Action: The applied action (
Block).
In just four steps, you've gone from a plain network connectivity failure to knowing the exact rule responsible—without needing to decipher complex memory dumps or XML files.
Summary of the Workflow
Enable auditing: Configure
auditpolto log Packet Drop and Connection.Capture the event: Search for Event ID 5152 in the Security log.
Extract the GUID: Copy the value from the
Filter Originfield.Query in PowerShell: Run
Get-NetFirewallRule -Name <GUID>to retrieve the human-readable rule name.
Once your investigation is complete, remember to disable or adjust auditing if you do not require it continuously, avoiding unnecessary growth of the security event log file.
Comments (1)
Log in to comment
Nice writeup, Richard! The Filter Origin vs. Filter Run-Time ID distinction is exactly the kind of thing that used to burn me. I'd chase a Run-Time ID after a reboot and end up back at square one. Good call calling that out explicitly as the Server 2022 improvement. ¡Buen artículo, Richard! La distinción entre el origen del filtro y el ID de tiempo de ejecución del filtro es precisamente el tipo de cosa que solía darme muchos quebraderos de cabeza. Me pasaba el rato buscando un ID de tiempo de ejecución tras reiniciar el sistema y acababa volviendo al punto de partida. Has acertado al señalarlo explícitamente como una mejora de Server 2022.